
What 414 million views taught us about AI creator videos
We measured 6,678 AI creator videos across 110 TikTok accounts. 42% got under 1,000 views, 1.7% produced 61% of all reach, and engagement rate inverts as views scale.
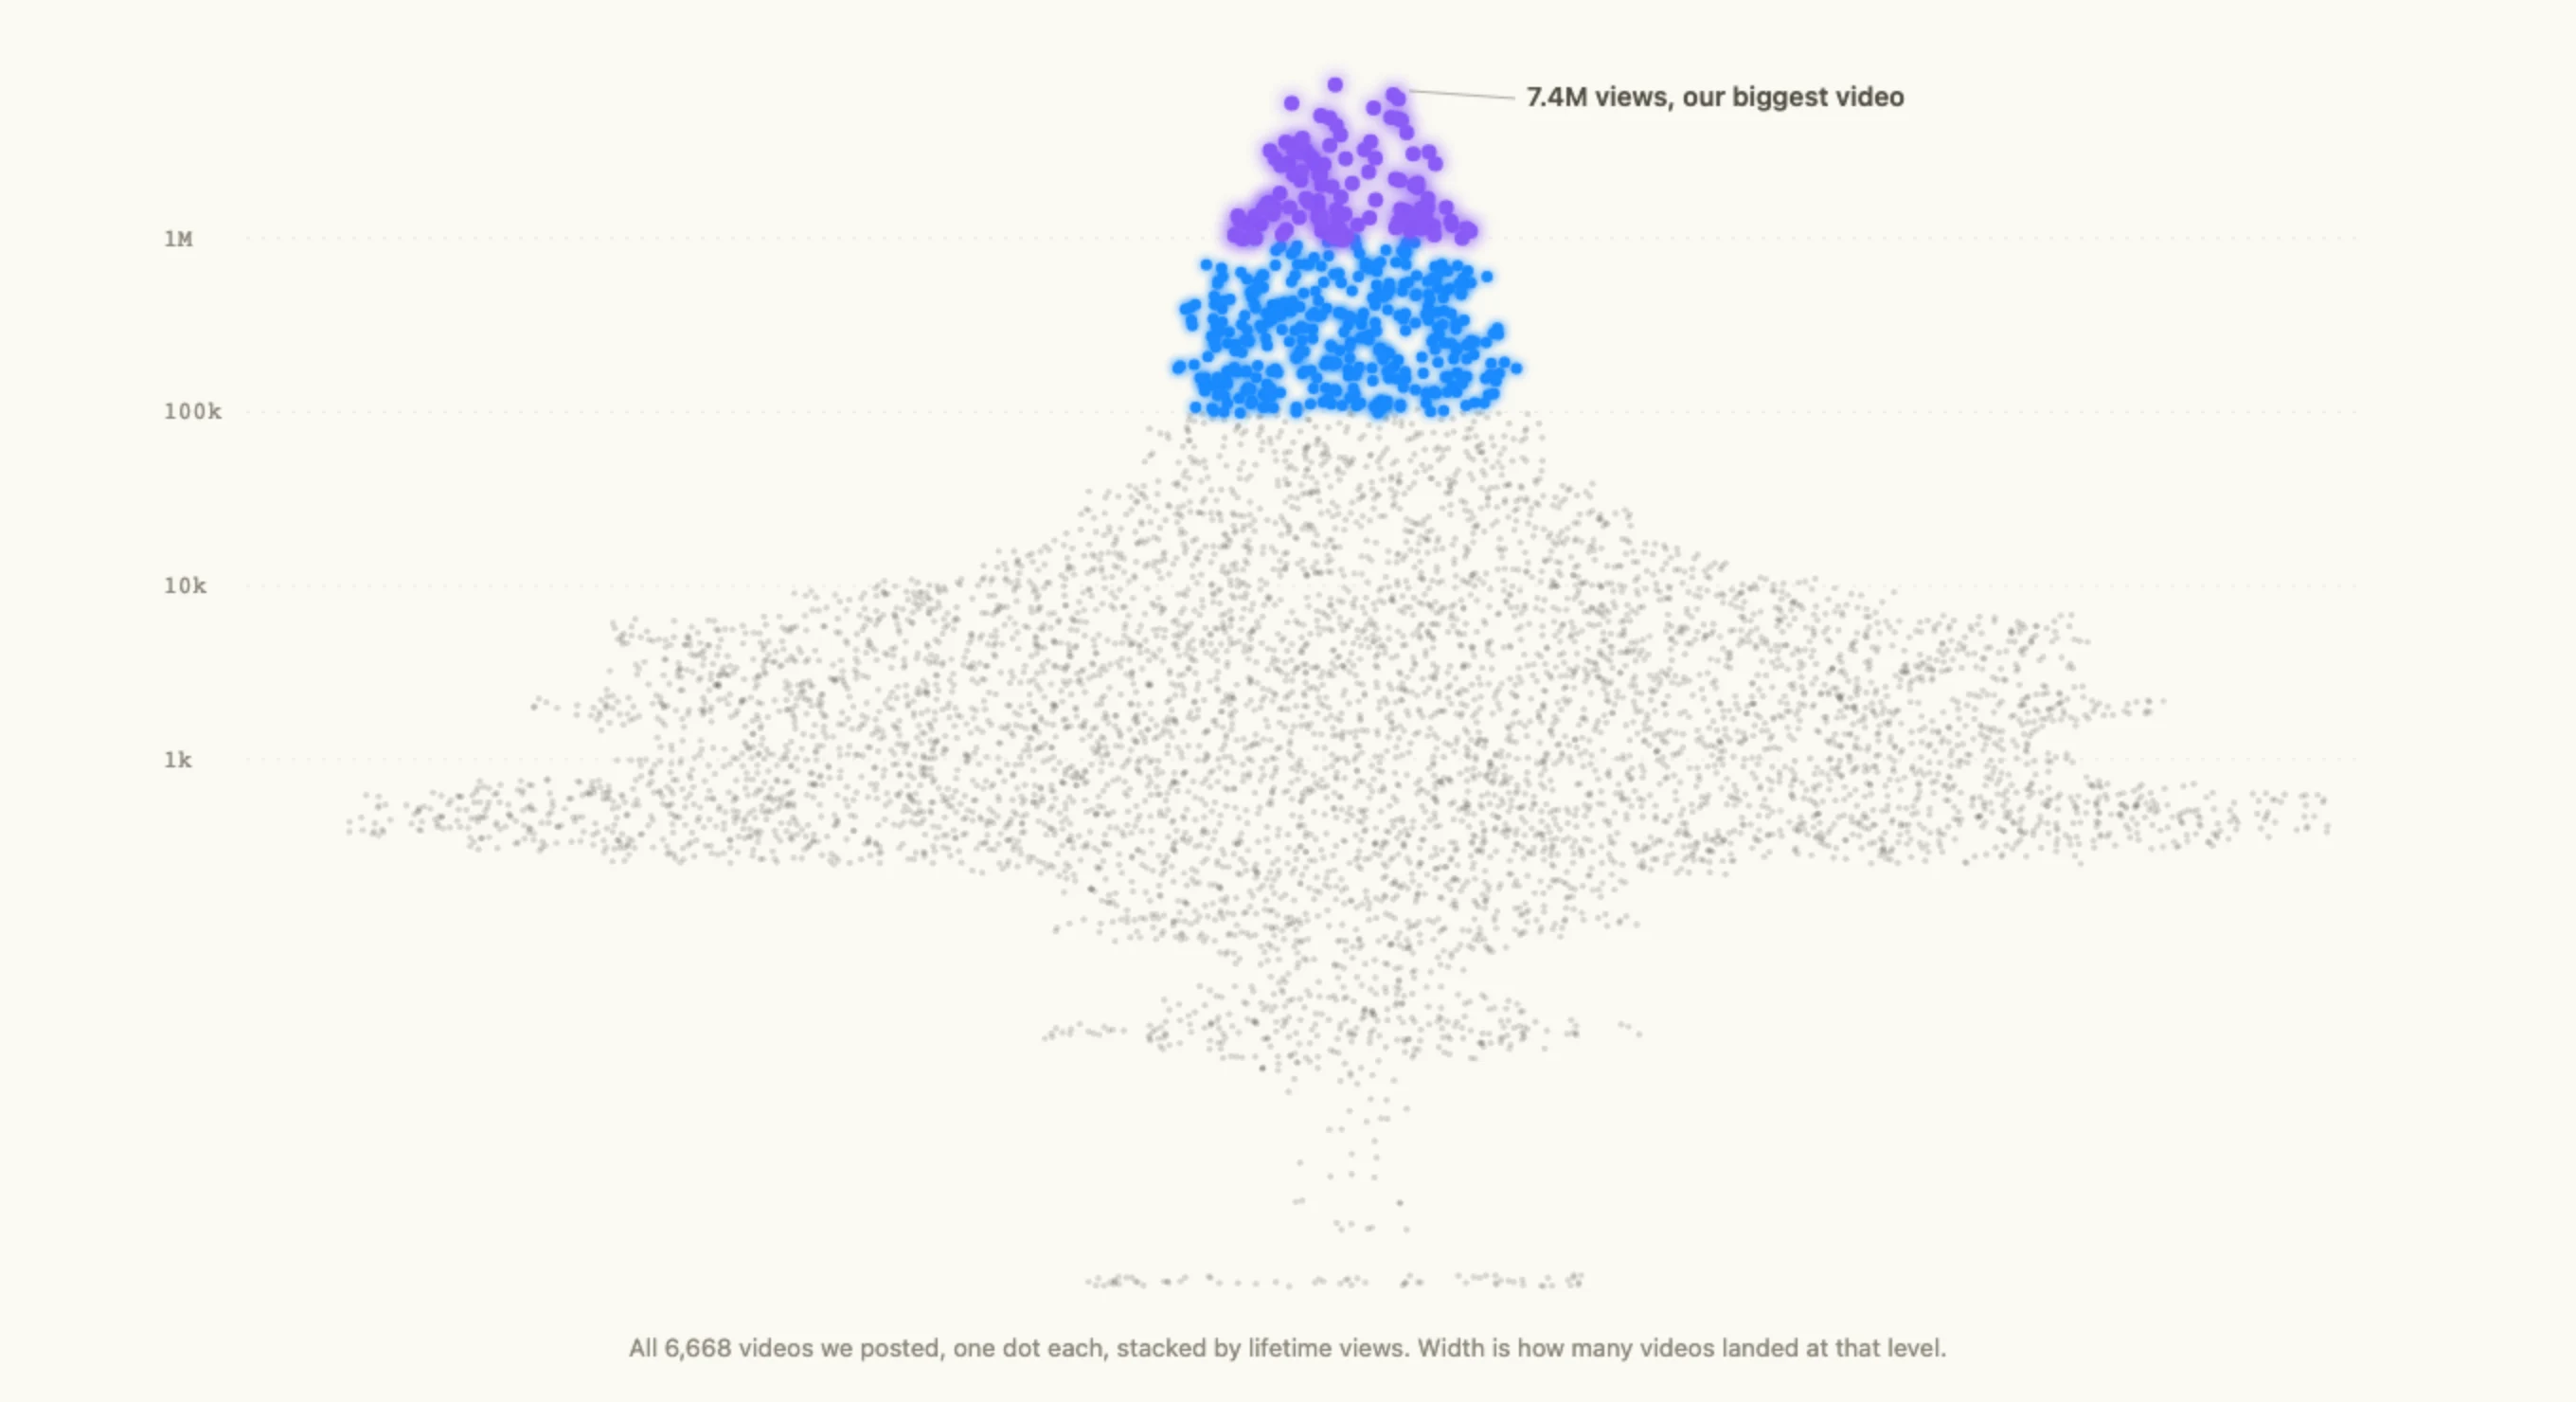
AI creator videos follow a brutal power law, and almost everything else you might optimise is noise. Across 6,678 videos posted from 110 TikTok accounts we run, 42% never reached 1,000 views, while the top 1.7% produced 61% of all 414 million views. Engagement rate ran inverse to reach, which changes when it matters, not whether it does.
We are publishing the numbers because we could not find them anywhere else. Every guide to AI UGC either shows one winning video or quotes a vendor's aggregate. Neither tells you what a month of posting actually looks like, which is what you need to plan one.
What exactly did you measure?
Every TikTok video on the creator accounts Pamba manages, as of 30 July 2026:
- 110 accounts with at least one published video, all AI creators, all posted from real iPhones
- 6,678 videos, posted between 22 March and 30 July 2026
- 414,148,586 views, plus likes, comments and shares, taken from the most recent metrics snapshot for each video
How are views actually distributed?
Nowhere near normally. Rank every video by views and count how much of the total each slice earned: the top 1% of videos earned 47.7% of every view we have ever gotten, and the top 5% earned 85.6%. The bottom half of the catalogue, combined, contributed 0.4%.
Bucketed, the same data shows the other side: how much of the catalogue never went anywhere.
- % of videos
- % of total views
In numbers:
| Views | Videos | Share of videos | Share of all views |
|---|---|---|---|
| 1M or more | 112 | 1.7% | 60.8% |
| 100k to 1M | 367 | 5.5% | 30.2% |
| 10k to 100k | 848 | 12.7% | 6.5% |
| 1k to 10k | 2,548 | 38.2% | 2.3% |
| Under 1k | 2,802 | 42.0% | 0.3% |
The bottom half of the catalogue contributed 0.8% of the reach. Eighty percent of videos landed under 10,000 views. The median video got 908.
A "failed" video is the expected outcome here, so the question is what a failure costs. If a video that gets 908 views costs you a day of shooting, this model is ruinous. If it costs a few cents of generation and no human minutes, the 1.7% pays for everything else many times over.
So how many videos does a hit take?
This is the number we now plan with:
- 1 in 14 videos crosses 100,000 views (479 of 6,678)
- 1 in 60 crosses 1,000,000 (112 of 6,678)
Read those as a planning constraint rather than a promise. Wanting one million-view video a month means posting roughly 60 times a month, which is two a day, which no human team sustains by hand for long. That arithmetic is the entire argument for automating distribution rather than just generation: the generator was never the bottleneck.
You know by day 1 (and winners compound for months)
Per video, though, you do not need a month. A typical non-hit banks nearly half of everything it will ever get within 24 hours; an eventual hit has barely started:
- Hits (100k+)
- Everything else
By day 3 the median eventual hit already had roughly 85,000 views and was still at only 19% of its final total. The median non-hit had under 700, and had already collected two thirds of everything it would ever get. Two rules fall out:
- Call it within 72 hours. The signal shows on day 1; a video that has not moved by day 3 is done.
- Winners compound for months. A hit is still earning a third of its views three weeks in, which is why a catalogue of old hits keeps producing views long after you stopped thinking about it.
The sweet spot is 10 to 19 seconds
Length is one of the few creative levers with a clean signal:
Videos of 10 to 19 seconds reached 100k at 10.1%, against 5.8% for under 10 seconds, 6.5% for 20 to 34 seconds, and 2.9% past a minute. Median views peak in the same bucket. Length correlates with content style, so treat this as a strong default rather than a law: long enough to land a beat, short enough to loop.
Does engagement rate predict reach?
We assumed the winners would be the videos people liked most. Across the whole catalogue, the opposite held:
| Hits (100k+) | Everything else | |
|---|---|---|
| Like rate | 1.09% | 2.72% |
| Comment rate | 0.017% | 0.153% |
| Share rate | 0.038% | 0.105% |
Videos that reached the most people had less than half the like rate of videos that reached almost nobody, and roughly a ninth of the comment rate. Every engagement metric moved the wrong way.
The mechanics explain it. A video confined to your own followers is shown to a warm audience that opted in, so a high fraction engages. A video that breaks out is shown to hundreds of thousands of cold viewers, most of whom keep scrolling, so every additional wave of distribution dilutes the rate. A million-view video has a low rate because millions of cold viewers pushed the denominator up.
Engagement rate still matters. What changes is when to read it:
- Breaking out requires a really high rate at the start, while views are still low. Early engagement from the first small audiences is what convinces the recommendation system to widen distribution. The hits in our set did not skip that stage; their rates were diluted afterwards by scale. The mistake is comparing the diluted final rate of a hit against the undiluted rate of a video that never left the followers pool and concluding the hit was worse. The snapshots bear this out: measured early, at comparable view counts (each video's first reading between 200 and 20,000 views), eventual hits were ahead, with a median like rate of 5.7% against 4.7% for everything else.
- TikTok rewards keeping people on TikTok, and that is bigger than your like count. Watch time, completions, rewatches, and whether the viewer keeps browsing after your video all feed distribution, and none of them show up as engagement on your video. A video can earn reach on retention alone.
The practical consequence: rank the catalogue on absolute views, and read engagement rate early, at comparable view counts, where a strong rate is the best breakout signal you have. What we stopped doing is treating the final rate as a scoreboard across videos of different sizes.
Are all accounts equally likely to produce a hit?
No, and this is the least convenient finding in the whole dataset. Of the 110 accounts, only 35 ever produced a video over 100,000 views. The other 68% never had one, despite a median of 40 published videos each, which is well past the point where 1-in-14 should have produced something.
The concentration by account is even steeper than by video. Our single best account earned 16.9% of all 414 million views. The top three earned 42.3%. The bottom half of accounts, combined, earned 0.2%.
The creators
106 accounts
The views they earned
414M views
And account quality persists: among accounts with 20+ posts, the ones that hit inside their first 10 posts converted 11.8% of their later posts into hits, against 4.3% for the ones that started cold. The creator is not a neutral pipe for the content.
The practical consequence is that creating, testing, and cycling avatars matters exactly as much as cycling content: give a new creator a bounded audition, retire the cold ones, and pour volume into the ones that prove they can hit, because winners hit repeatedly (our two best accounts have 70 hits each). The full account-level analysis, with the audition-window math, is its own post: The avatar lottery.
What we changed because of this
- Volume over polish, deliberately. Not because quality is irrelevant, but because the distribution says the marginal video is worth more than the marginal revision. Cheap generation is what makes that rational.
- Absolute views as the ranking signal, with engagement rate read early and at comparable view counts rather than as a final scoreboard.
- Portfolios of accounts rather than a flagship account, with underperformers replaced instead of nursed (the avatar lottery has the numbers behind this).
- 10 to 19 seconds as the default length, since it converts to hits at roughly twice the rate of anything longer.
- A 72-hour verdict per video. A video that has not moved by day 3 never will; the winners are the ones still climbing.
- Monthly review windows. Daily numbers in a power-law process are pure noise, and reacting to them is how teams talk themselves out of a strategy that is working.
What this data can't tell you
This is one company's fleet over four months, weighted toward the niches our customers sell into, on a recommendation system that changes under everyone. Expect the shape to hold (power laws in short-form are well documented) and treat the exact ratios as ours. If you run enough volume to compute your own, use those instead.
We will republish these numbers as the set grows.